This is an old revision of the document!
Table of Contents
Telegraph
Telegraph is a multi-purpose tool which provides sensor probes, data gathering, web graphing and reporting. It is designed specfically for Raspberry Pi and uses cheap and easily obtained sensors.
For sensors, Telegraph provides a number of external Simple Network Management Protocol (SNMP) daemon processes which gather data from various devices on a Raspberry or Banana Pi. The values returned are used to populate a round robin (RRD) or SQL database either with Telegraph or a tool of your own choice.
Telegraph can also use ICMP to measure network latency when gathering data. For SNMP polling, Telegraph also supports network interface names which are mapped when querying.
Telegraph is run from CRON at regular 5 minute intervals for data gathering and the probes are configured within the net-snmp config. Although the probes are designed for the Raspberry Pi, the gathering host need only run Linux.
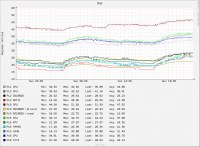
PHP scripts demonstrate how you can access the RRD files and generate graphs on a web page like the one shown above.
Telegraph can also report via e-mail, XMPP, or HTTP POST when either a target is offline or a retrieved value falls outside a specified range.
Install
First install mercurial to download telegraph.
sudo apt-get install mercurial
hg clone http://hg.kewl.org/pub/telegraph
cd telegraph
Now view the instructions found in the README file in the telegraph directory which explains the installation process.
Sensor probes
For the SNMP (simple network management protocol) daemon, Telegraph supplies the following sensor probe processes which may be used.
| Process | Use |
|---|---|
| ads1115 | Analog to digital conversion |
| bh1750fvi | Illuminance |
| bme280 | Pressure + temperature + humidity |
| bmp180 | Pressure + temperature |
| bmp280 | Pressure + temperature |
| dht11 | Humidity + temperature |
| ds18b20 | Temperature |
| ds3231 | Temperature |
| lm75 | Temperature |
| mcp3008 | Analog to digital conversion |
| pcf8591 | Analog to digital conversion |
| si7021 | Humidity |
| soc | Temperature |
| tc74 | Temperature |
| tm7705 | Analog to digital conversion |
| tsl2561 | Illuminance |
Analog to digital conversion devices all provide the following features.
| Name | Use | Schematic |
|---|---|---|
| RAW DATA | Device specific value | |
| LEVEL | Value scaled 0..1 | |
| SCALE LEVEL | value scaled 0..N | |
| RESISTANCE | Resistance calculation | VCC - R - LEVEL - R? - GND |
| VOLTAGE | Voltage calculation | |
| LM19 | Temperature | |
| LM35 | Temperature | |
| LM335 | Temperature | |
| MCP9700 | Temperature | |
| MCP9701 | Temperature | |
| TMP36 | Temperature | |
| LDR | Light calculation | VCC - R - LEVEL - LDR - GND |
| NTC | Temperature calculation | VCC - R - LEVEL - NTC - GND |
Each probe has a set of command line arguments specific to that probe type.
$ bmp180
USAGE: bmp180 I2C-DEV I2C-ADDR MODE
Program to query the BMP180.

Error: missing arg(s).

MODE:
 0 TEMPERATURE
 2 PRESSURE

VERSION:
 1.0
U
I2C-DEV represents the device node of the i2c bus the device is on. The I2C-ADDR is the bus address. MODE determines what type of reading is required.
In operation it can look like this:
$ bmp280 /dev/i2c-1 0x76 0
20.741

$ bmp280 /dev/i2c-1 0x76 2
1003.037

$ bmp280 /dev/i2c-1 0x76 1
U
In the first two instances, temperature and pressure are retrieved, in the last case U is returned which represents UNKNOWN since this device doesn't support that MODE.
For analog to digital conversion, all levels and calculations are referenced to the 3V3 supply voltage. For example, the VOLTAGE calculation simply takes the LEVEL value and multiplies it by 3.3.
For the light calculation (lux) the following formula is used.
log(lux) = (log(ldr) - intercept) / slope
The slope and intercept are device dependant and this may be calculated using the Telegraph 'meter' command line tool using a reference device like the tsl2561. The results can produce a reasonable approximation for lux with very cheap components.
The NTC calculation uses this formula.
1/T = 1/To + 1/B . ln(R/Ro)
B is known as the NTC B25 value and Ro is R25 on the datasheet for the device. R is the known resistance of the device at the current temperature and the B25/R25 values are representative of room temperature at 25'C.
SNMP
The SNMP configuration uses the net-snmp extend feature to configure SNMPD to return values when probed. The extend feature allows an arbitrary process to report a text string which is returned to the client. For RRD and Telegraph, this value is text string representing a numerical value, else U which means UKNOWN.
/etc/snmp/snmpd.conf
rocommunity public X.X.X.X/24
extend cpu /usr/local/bin/soc /sys/class/thermal/thermal_zone0/temp
In this simple example, a net-snmp extend is set to return the CPU temperature when queried.
After changing the snmp config it must be restart for the new setting to take efect.
/etc/init.d/snmpd restart
Data gathering
This configuration file sets up a query for the above cpu temperature in snmpd.conf.
/etc/telegraph/cpu.xml
<?xml version="1.0"?>
<telegraph title="CPU">
 <graph label="C" />
 <database type="rrd" filename="cpu.rrd" />
 <query source="0" name="cpu" host="X.X.X.X" community="public" extend="cpu" />
</telegraph>
The title is used by both graphing and reporting. For graphing it will appear at the head of a graph and with reporting it will be the subject of the report.
The rrd file is where data is stored, by default this will be in /var/lib/telegraph but a path may be specified if required.
Multiple queries may be entered, starting at source 0 and incrementing by one for each new query.
Only similar data types can exist in one configuration file, for example, only temperature or only network activity. Data types cannot be mixed and demand separate configurations and databases.
If an RRD file exists and a new query is added, it will not work and a new column must be added to the RRD file beforehand.
Telegraph supplies a command line tool 'rrdadd' which will add 1 or more blank columns to allow new sources to be added easily to an already existing RRD file.
CRON
CRON should run Telegraph every 5 minutes to gather data.
*/5 * * * * /usr/local/bin/telegraph -d 0 cpu.xml
This cron job will fetch values and store them in the database as configured by cpu.xml
The -d option is a delay value, it can be used to delay the process from cron when multiple telegraph processes are executed in parallel to stagger their processing and potential load on the system or target systems.
*/5 * * * * /usr/local/bin/telegraph -d 0  cpu.xml
*/5 * * * * /usr/local/bin/telegraph -d 30 network.xml
World wide web
Example configuration exists in the demo directory of the project which is used to demonstrate its operation with PHP scripts that are installed in /var/www/telegraph
The london demo can be seen here. This demo uses a proxy cache so the resultant graphs may be slightly dated.
The demo has been designed to work with apache2 but nginx will also work well.
Reporting
Telegraph can report problems it finds when gathering data or when a returned value is out of range.
Problem reports are of two types, DOWN and UP, which signify if a source was not available or available to be queried. This could mean that the SNMP service was offline, or that ICMP PING could not reach a host.
A DOWN report will occur when a problem is found, and an UP when the problem is resolved. Whilst a service continues to be DOWN, or UP, no reports are made.
Range reports occur when a value goes below or equal to a preset LOW value or becomes equal to or rises above an preset HIGH value in the configuration. This could be used to send reports when temperature goes too low or rises too high, for example. Range reports only work with both LOW and HIGH values given and no reports are made unless the value returns to one state or the other.
Three types of report delivery exist, e-mail, XMPP and HTTP POST.
E-mail reporting requires sendmail or equivalent to be installed and XMPP demands a valid jabber/xmpp account to use as a sender. HTTP POST is set up to work with the RUN/STOP watchdog service at runstop.uk
The Telegraph XML configuration file is updated for reporting.
<monitor host="raspberry-pi" filename="cpu.db" init="monitor.sql" table="monitor" />
<report type="email"    active="1" to="me@example.com" />
<report type="xmpp"     active="1" to="me@xmpp.example.com" auth="xmpp" />
<report type="watchdog" active="1" to="https://cgi.runstop.uk/watchdog/" auth="watchdog" />
The monitor line sets up an SQL database file used to monitor query state (UP, DOWM, LOW and HIGH).
The three report lines demonstrate sending reports. The first is e-mail, the second sends a jabber message to the destination using credentials found in the file /etc/telegraph/xmpp. This file is two lines, one being jabber identity and then second password. This file cannot be world readable. The last line post an HTTP message to the runstop.uk server using the credentials in NETRC format found in /etc/telegraph/watchdog. This file may not be world readable either.
The content of a report contains 1 or more lines in CSV format.
Here is an ICMP report of hosts which do not respond to ICMP PING.
"Pi2 AR9271", 192.168.0.162, ICMP, DOWN, 0
"Pi4 BCM43143", 192.168.0.164, ICMP, DOWN, 0
"PiC AR9287", 192.168.0.172, ICMP, DOWN, 0
"PiE RTL8191SU", 192.168.0.174, ICMP, DOWN, 0
The columns are name, host, query type, status, value. For ICMP value will be 0 or 1.
This is a range report.
"Pi7 DS18B20 room", 192.168.0.167, SNMP, HIGH, 20
This report show that a HIGH level of 20 has been reached by a temperature probe.
Other tools
If you want to use the telegraph probes with SNMP but not use Telegraph to gather data then you can use the Telegraph 'extend' command line tool to generate the required SNMP MIBs for queries by other tools.
For example, for the following SNMP configuration.
extend cpu /usr/local/bin/soc /sys/class/thermal/thermal_zone0/temp
The MIB can be determined with extend.
$ extend cpu
1.3.6.1.4.1.8072.1.3.2.3.1.1.3.99.112.117
Test it somewhat like this.
$ snmpget -v2c -c public X.X.X.X 1.3.6.1.4.1.8072.1.3.2.3.1.1.3.99.112.117
NET-SNMP-EXTEND-MIB::nsExtendOutput1Line."cpu" = STRING: 34.166
How you use the MIB in other tools is of course, tool specific.


